Seafood provides sustenance for billions of people and livelihoods for tens of millions, yet the full global reach of high seas fishing has remained largely a mystery until now. A team of researchers, including Stanford scientists, has directly quantified industrial fishing’s footprint using satellites and onboard ship-locating technology.
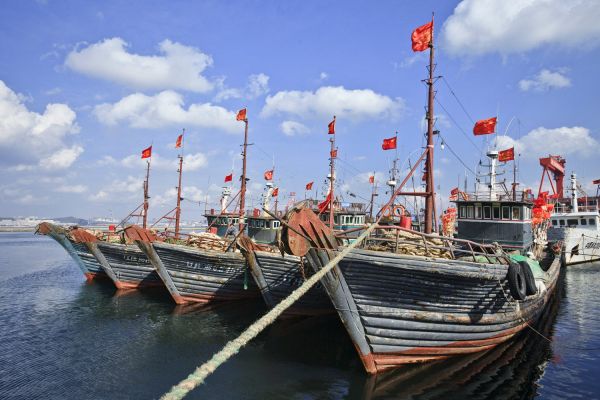
Fishing vessels moored in Dalian, China. The country’s fishing fleets is by far the most active in the world, according to new satellite tracking data. (Image credit: TonyV3112 / shutterstock)
Their data reveal, among other surprises, that five countries account for more than 85 percent of high seas fishing, and holidays affect fishing patterns much more than fish migrations or ocean conditions.
“This highlights the impact of industrial fishing with an unprecedented level of detail and transparency,” said study co-author Barbara Block, the Charles and Elizabeth Prothro Professor in Marine Sciences. “It could help shape more sustainable practices that ensure a future for tunas, billfish and sharks.”
The study, published Feb. 22 in Science, opens a gateway to better management of global fleets and their response to changes in climate, policy, economics and other drivers.
An innovative approach
Advances in satellite technology and big data techniques have previously led to more accurate agricultural forecasts and more effective forest carbon storage approaches, but they had done little to clarify the global footprint of fishing.
“To realize the potential of these new technologies, we assembled a team of data scientists, software engineers, ecologists and economists,” said study lead author David Kroodsma, director of research and development at Global Fishing Watch. “It was the only way to process such a vast amount of data and turn it into knowledge about where and when fishing is taking place.”
China, Spain, Taiwan, Japan and South Korea accounted for more than 85 percent of observed fishing effort on the high seas beyond their territorial waters.
Ships routinely broadcast their identity, position, speed and turning angle every few seconds as a way of preventing collisions. As it turns out, satellite-based receivers also pick up on these signals, sent through a system called Automatic Identification System (AIS). To take advantage of this existing data, the researchers designed artificial intelligence algorithms to process billions of AIS position signals from more than 70,000 fishing vessels over a four-year period (2012 – 2016).
The algorithms detected ship positions indicative of fishing vessel type and activity. They identified vessel characteristics such as length (from 18 to 438 feet), engine power and gross tonnage – all with more than 90 percent accuracy when compared to official fleet registries.
Although the researchers tracked only a small proportion of the world’s estimated 2.9 million motorized fishing vessels, they collected data on up to 75 percent of vessels in the world longer than 72 feet and more than 75 percent of vessels longer than 108 feet. Ships in these two categories are responsible for the majority of global high seas fishing.
A clearer picture
The resulting dataset was eye-opening.
While most nations appeared to fish predominantly within their own exclusive economic zones, China, Spain, Taiwan, Japan and South Korea accounted for more than 85 percent of observed fishing effort on the high seas beyond their territorial waters.
Unlike agriculture, which revolves around seasonal cycles of plant and animal growth, the temporal footprint of fishing appeared surprisingly consistent through time. Christmas and weekends had the greatest effect on fishing patterns in most of the world, while Chinese New Year and state-imposed summertime fishing bans had the biggest impact on the movements of Chinese fleets. While some fleets displayed seasonal movements, the work week, holidays and political closures were much more influential than natural cycles in determining the temporal footprint of fishing at a global scale.
The researchers calculated that more than 55 percent of the ocean was fished in 2016 alone. While this estimate is lower than previous studies have suggested, it is more precise and still more than four times the area of all the world’s agricultural land.
Ocean opportunities
While the study shows fishing hotspots in the Northeast Atlantic, Northwest Pacific, and some regions off South America and West Africa, it also shows low levels of fishing in the Southern Ocean and parts of the Northeast Pacific that may be among the most pristine open ocean areas on the planet and where Block and colleagues spent over a decade tagging and studying large pelagic fish and sharks. Some of these regions – such as an important migratory gathering spot halfway between Hawaii and California, dubbed the White Shark Café – have been proposed as potential world heritage sites.
To further understanding of global fisheries, the researchers have made daily high-resolution graphical overviews of global of fishing effort publicly available through globalfishingwatch.org. These data not only provide a powerful tool for improved ocean governance, but can help assess existing management regimes and accelerate development of new approaches that respond in real-time to changing ocean conditions, management issues or conservation concerns.
“This is a game-changing platform that can generate validated local and global maps of industrial fishing at unprecedented scale and resolution,” said study co-author Francesco Ferretti, a research associate at Stanford’s Hopkins Marine Station.
Block is also an affiliate of the Stanford Woods Institute for the Environment. Additional authors include Stanford biology graduate student Tim White; researchers from the University of California, Santa Barbara; Global Fishing Watch; SkyTruth; Dalhousie University; and Google.
Funding for the study was provided by the Leonardo DiCaprio Foundation, Bloomberg Philanthropies, the Wyss Foundation, the Waterloo Foundation, the Adessium Foundation and the Bertarelli Foundation, together with Google, Oceana and the National Science Foundation
Media Contacts
Barbara Block, Hopkins Marine Station: (831) 655-6236, bblock@stanford.edu
Francesco Ferretti, Hopkins Marine Station: (831) 233-4905, ferretti@stanford.edu
Tim White, Hopkins Marine Station: (831) 655-6206, timwhite@stanford.edu
Rob Jordan, Stanford Woods Institute for the Environment: (650) 721-1881, rjordan@stanford.edu
Author
Rob Jordan