The runaway train that is climate change is about to blow past another milestone: global fossil-fuel carbon dioxide emissions will reach yet another record high. Driven by rising natural gas and oil consumption, levels of CO2 are expected to hit 36.8 billion metric tons (40.6 billion U.S. tons) this year, according to new estimates from the Global Carbon Project, an initiative led by Stanford University scientist Rob Jackson.

A liquified natural gas tanker at dock. Because of greater supply and cheaper prices, natural gas usage has surged, accounting for 60 percent of fossil emissions growth in recent years. (Image credit: Ken Hodge/Flickr)
The findings are outlined in three new papers published in Earth System Science Data, Environmental Research Letters, and Nature Climate Change. Although the rate of emissions growth is slower than in the previous two years, the researchers warn emissions could keep increasing for a decade or more unless energy, transportation and industry policies change dramatically across the world.
“When the good news is that emissions growth is slower than last year, we need help,” said Jackson, a professor of Earth system science in Stanford’s School of Earth, Energy & Environmental Sciences (Stanford Earth). “When will emissions start to drop?”
The new projections come as international negotiators meet in Madrid for the 25th conference of the United Nations Framework Convention on Climate Change. Jackson and his colleagues make clear policymakers have their work cut out for them, estimating global carbon dioxide emissions from fossil fuel sources – which represent roughly 90 percent of all emissions from human activities – will grow a projected 0.6 percent over 2018 emissions. That compares to 2.1 percent growth a year earlier and 1.5 percent growth in 2017.
Glimmers of hope, such as the dramatic decline of coal use in the European Union and United States, are overshadowed by surging natural gas and oil use around the world, according to the researchers. Per capita emissions in affluent countries remain disproportionately high – a fact that further complicates the picture as developing countries seek greater prosperity through more natural-gas-fueled electricity and gasoline-powered vehicles and air travel.
Go to the web site to view the video.
“Emissions cuts in wealthier nations must outpace increases in poorer countries where access to energy is still needed,” said Pierre Friedlingstein, a mathematics professor at the University of Exeter and lead author of the Global Carbon Budget paper in Earth System Science Data.
Coal’s decline and natural gas’s rise
The group found that the U.S., E.U. and China account for more than half of all carbon dioxide emissions globally. While annual emissions are decreasing slowly in many industrialized regions, including the U.S., where they are down a projected 1.7 percent since last year, they are growing in many countries, including China, where they should rise 2.6 percent this year. About 40 percent of global carbon dioxide emissions were attributable to coal use, 34 percent from oil, 20 percent from natural gas, and the remaining 6 percent from cement production and other sources.
Although still a major factor in global emissions, coal has taken a hit, with global usage down 0.9 percent for the past year. In 2019, consumption of coal is expected to drop 11 percent in the U.S. – down 50 percent from its peak in 2005 – displaced by cheaper natural gas, wind and solar power, as well as savings from energy efficiency. Coal use should drop a further 10 percent in the E.U. In China, which accounts for half of global coal use, growth slowed to 0.8 percent this year due in part to China’s economic downturn.
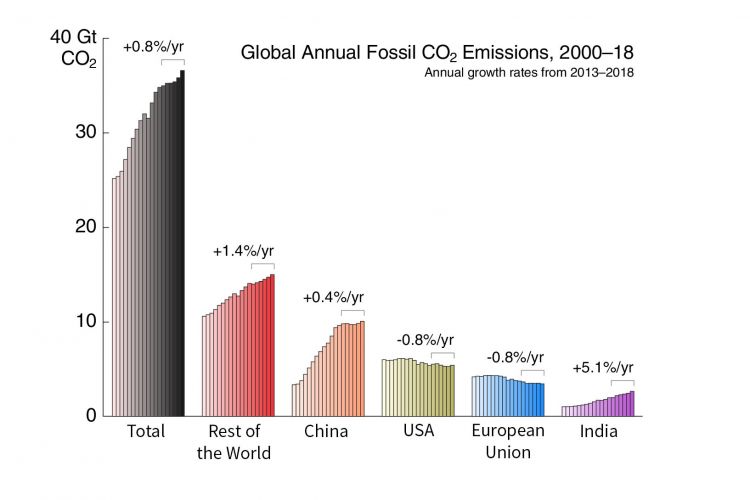
Fossil carbon dioxide emissions, including cement production, globally and for five regions. Brackets show average annual growth rate for 2013 to 2018. Units are in metric gigatons. (Image credit: Jackson, et al. 2019 Environ Res Lett; https://doi.org/10.1088/1748-9326/ab57b3)
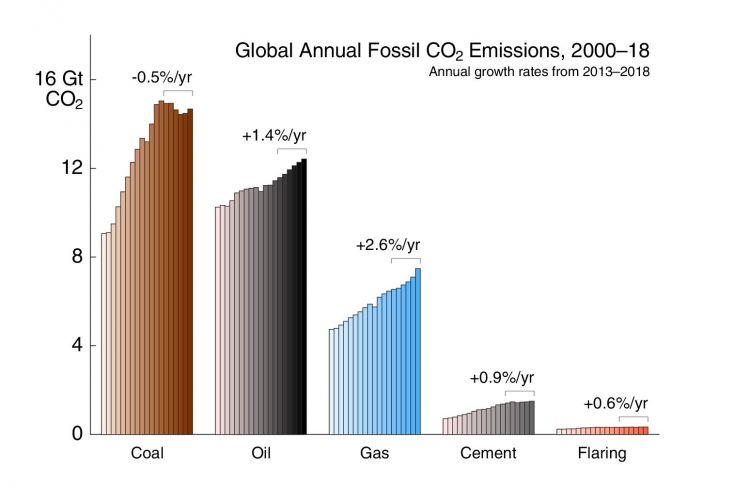
Global carbon dioxide emissions by fuel type (coal, oil and natural gas) plus emissions from cement production and flaring. Brackets show average annual growth rate for 2013 to 2018. Units are in metric gigatons. (Image credit: Jackson, et al. 2019 Environ Res Lett; https://doi.org/10.1088/1748-9326/ab57b3)
“Declining coal use in the U.S. and Europe is reducing emissions, creating jobs and saving lives through cleaner air,” said Jackson, who is also a senior fellow at the Stanford Woods Institute for the Environment and the Precourt Institute for Energy. “More consumers are demanding cheaper alternatives such as solar and wind power.”
Billed by some as a “bridge fuel” away from more pollutive energy sources, natural gas produces significantly fewer carbon dioxide emissions than oil or coal. Because of greater supply and cheaper prices, natural gas usage has surged, with an attendant 2.6 percent increase in carbon dioxide emissions for 2019. In fact, rising natural gas use accounts for 60 percent of fossil emissions growth in recent years.
The researchers warn that hopes for natural gas to be a bridge fuel can only come true with measures, such as carbon capture and storage, to mediate the fuel source’s emissions and a reduction in methane leakage from natural gas infrastructure.
Emissions responsibility
While some wealthier countries have made substantial progress in reducing overall emissions, per capita emissions in these countries remain stubbornly high.
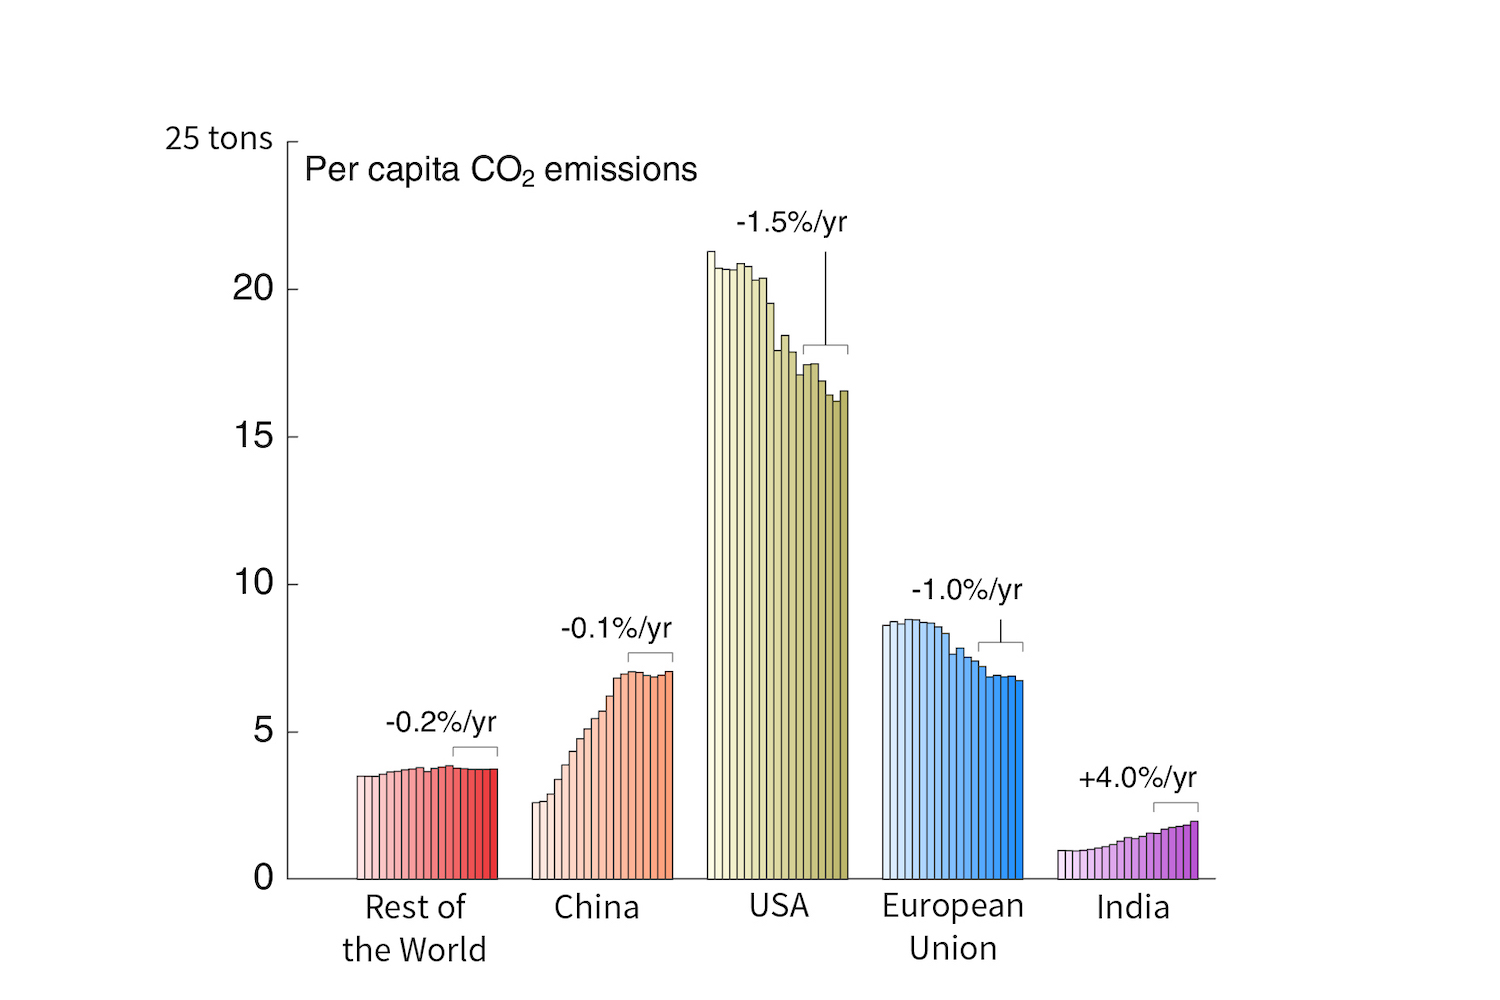
Per capita carbon dioxide emissions from 2000 to 2018. Brackets show average annual changes for 2013 to 2018. Units are in metric tons. (Image credit: Jackson, et al. 2019 Environ Res Lett; https://doi.org/10.1088/1748-9326/ab57b3)
Around the world, the average person is responsible for about 4.8 metric tons (5.3 U.S. tons) of fossil carbon dioxide emissions per year. By comparison, the average person in the United States is responsible for more than three-and-a-half times that amount. Success stories, such as the E.U., where emissions have been declining about 1 percent per year are counterbalanced by the story of countries such as China, where per capita carbon dioxide emissions have grown to rival or even exceed those of the E.U.
Strong inequalities still exist, particularly in per capita oil use. U.S. oil consumption per person is 16 times greater than in India and six times greater than in China. Vehicle ownership is similarly skewed, with almost one motor vehicle per person in the United States but only one for every 40 people in India and 6 in China. A similar rate of car ownership in China or India as in the United States would put a billion new cars on the road in either country.
Light at the end of the tunnel?
To counterbalance increasing emissions, the researchers call for stronger national policies and global commitments to help institute carbon pricing, accelerate energy efficiency improvements, reduce energy consumption, deploy electric vehicles, ramp up carbon capture and storage technologies and replace fossil fuels with renewable sources.
More than 18 countries have found a way to expand their economies over the past decade while reducing carbon dioxide emissions, according to an earlier study that included co-authors affiliated with the Global Carbon Project. The countries include the United Kingdom and Denmark, which coupled stable or declining energy use with new renewable fuel capacity that displaced fossil fuel use.
“We need every arrow in our climate quiver,” Jackson said. “That means stricter fuel efficiency standards, stronger policy incentives for renewables, even dietary changes and carbon capture and storage technologies.”
To read all stories about Stanford science, subscribe to the biweekly Stanford Science Digest.
Rob Jackson is Stanford’s Michelle and Kevin Douglas Provostial Professor and a senior fellow at the Precourt Institute for Energy. Co-authors of the paper in Environmental Research Letters are affiliated with the University of East Exeter; the Ecole Normale Superieure in Paris, France; the Center for International Climate Research in Oslo, Norway; the Commonwealth Scientific and Industrial Research Organization (CSIRO) in Canberra, Australia; and the University of East Anglia.
The research received support from the Center for Advanced Study in Behavioral Sciences at Stanford University, the Gordon and Betty Moore Foundation, the Australian Government’s National Environmental Science Programme’s Earth Systems and Climate Change Hub, the European Commission Horizon 2020 project VERIFY, and Future Earth.
Media Contacts
Rob Jackson, Department of Earth System Science, (650) 497-5841, rob.jackson@stanford.edu
Rob Jordan, Stanford Woods Institute for the Environment, (650) 721-1881, rjordan@stanford.edu
Author
Rob Jordan