In the race to document the species on Earth before they go extinct, researchers and citizen scientists have assembled billions of records. Most records either come from physical specimens in a museum or digital field observations, but both are useful for detecting shifts in the number and abundance of species in an area. However, a new Stanford study has found that both record types are flawed, and the degree to which they are riddled with coverage gaps and biases depends on the kind of dataset.

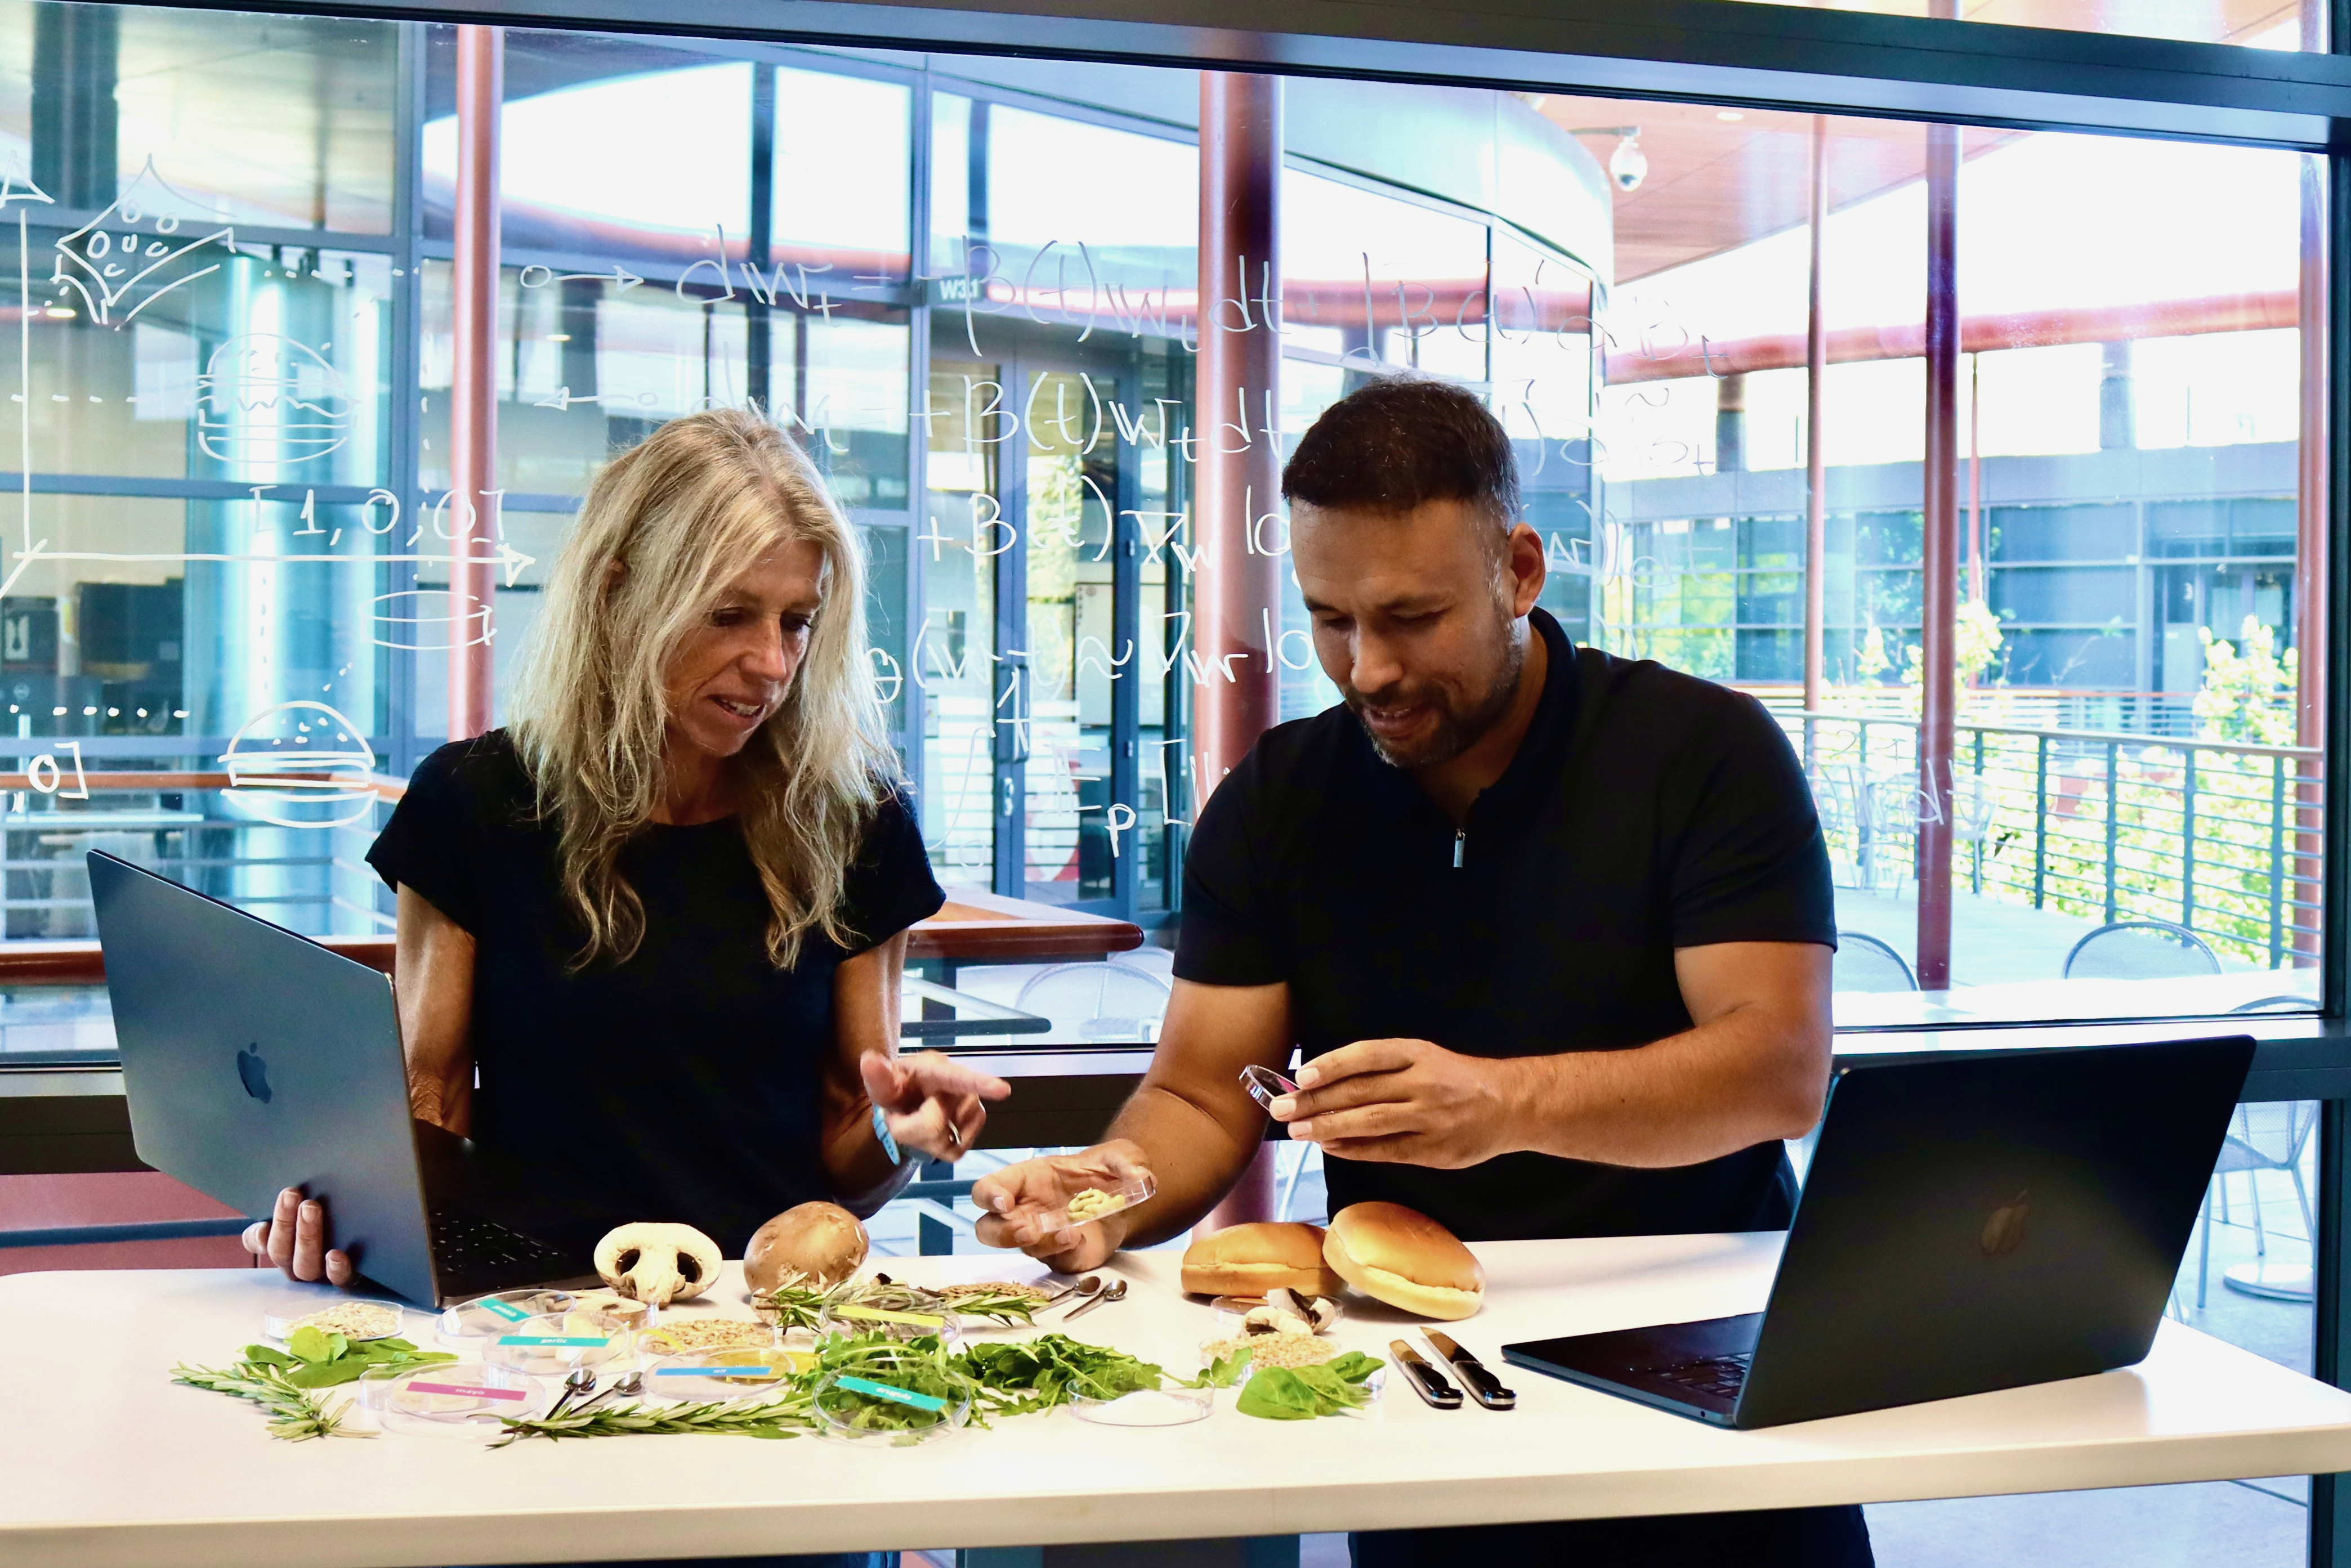
Barnabas Daru (Image credit: Andrew Brodhead)
Back in Charles Darwin’s day, and up until relatively recently, naturalists recorded the species present in an area by collecting and preserving samples of the plants, insects, fish, birds, and other animals in a region for museums and educational collections. Today, most records of biodiversity are often in the form of photos, videos, GPS coordinates, and other digital records with no corresponding physical sample of the organism they represent in a museum or herbarium.
“With the rise of technology it is easy for people to make observations of different species with the aid of a mobile application,” said Barnabas Daru, assistant professor of biology in the Stanford School of Humanities and Sciences.
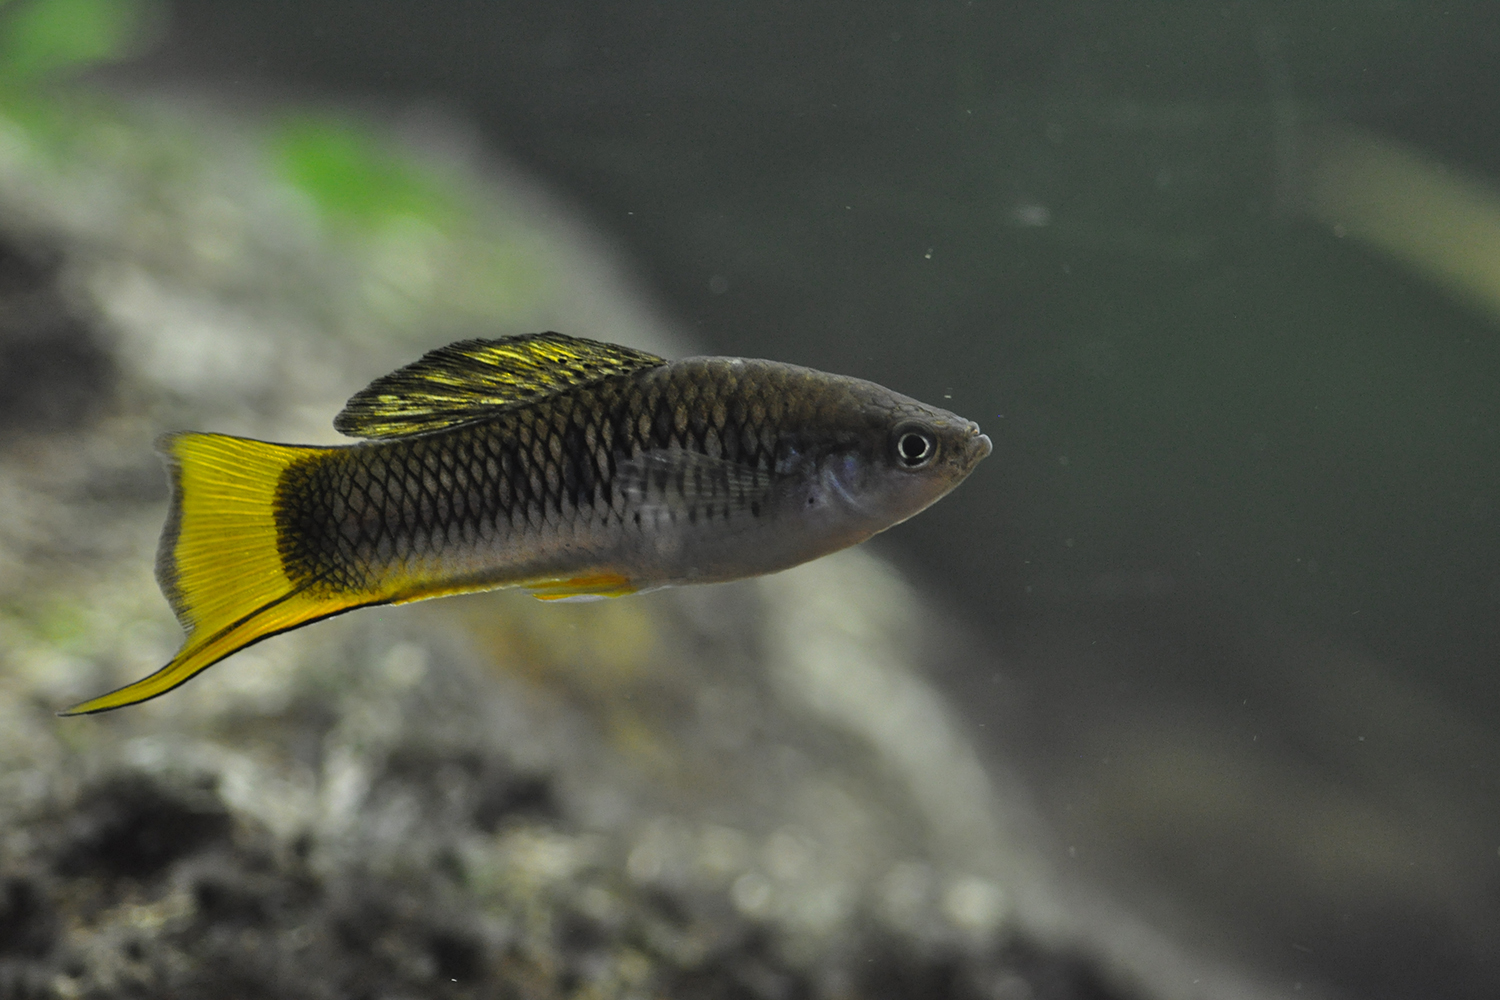
For example, if someone spots an attractive butterfly or plant, they can easily document it by taking a photo and uploading it to a biodiversity app with details such as the species’ name, location, date, and time. This information becomes a valuable field observation.
“These observations now outnumber the primary data that comes from physical specimens,” said Daru, who is lead author of the study, published May 1 in Nature Ecology & Evolution. “And since we are increasingly using observational data to investigate how species are responding to global change, I wanted to know: Are these data usable?”
While other studies have explored global coverage and biases in biodiversity data, this is the first known global assessment of coverage gaps and biases in specimen versus observational records across multiple dimensions.
A digital museum
Using a global dataset of 1.9 billion records of terrestrial plants, butterflies, amphibians, birds, reptiles, and mammals, Daru and co-author Jordan Rodriguez, tested how well each type of data captures actual global biodiversity patterns across taxonomic, geographic, temporal, and functional trait axes.
People trample on ants all the time, but if an elephant were to stroll down the street, everyone would want to know what was going on.
—Barnabas Daru
Assistant Professor of Biology
“We were particularly interested in exploring the aspects of sampling that tend to bias data, like the greater likelihood of a citizen scientist to capture a flowering plant instead of the grass right next to it,” said Rodriguez, a University of Oregon graduate student who started collaborating with Daru at Texas A&M-Corpus Christi as an undergraduate.
For instance, to test coverage of actual biodiversity patterns in taxonomic space, they overlayed grids of different sizes (50, 100, 200, 400, 800, and 1600 km) across a digital map of the world. Within each grid cell, and for each family (e.g., ducks, geese, and waterfowl are one bird “family”), they assessed the number of documented species compared to the expected number of species for that region or family based on expert opinion.
Biases in data collection were assessed by comparing the number of specimens and observations from a grid cell to the expected amount if each datapoint was collected randomly.
Their study revealed that the superabundance of observation-only records did not lead to better global coverage. Moreover, these data are biased and favor certain regions (North America and Europe), time periods, and organisms.
This makes sense because the people who capture observational biodiversity data on mobile devices are often citizen scientists recording serendipitous encounters with species in areas nearby, such as roadsides, hiking trails, community parks, and neighborhoods.
Observational data are also biased toward certain organisms with attractive or eye-catching features.
“People trample on ants all the time, but if an elephant were to stroll down the street, everyone would want to know what was going on,” said Daru.
In contrast, collectors of preserved specimens are often trained professionals who gather samples of plants, animals, and other organisms in remote and wilderness areas as part of their jobs.
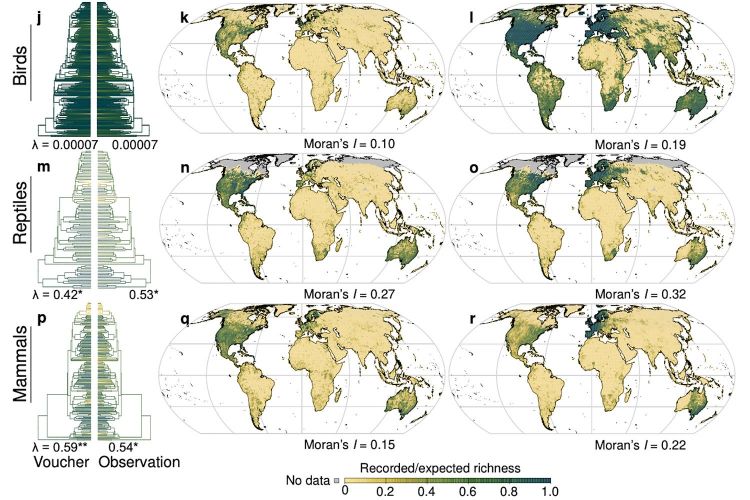
A visual representation of the coverage of bird, reptile, and mammals for “voucher” specimens (maps labeled k, n, and q) and observations (maps labeled l, o, r) compared to the expected species richness based on expert opinion for each region of the world. (Image credit: Barnabas Daru and Jordan Rodriguez)
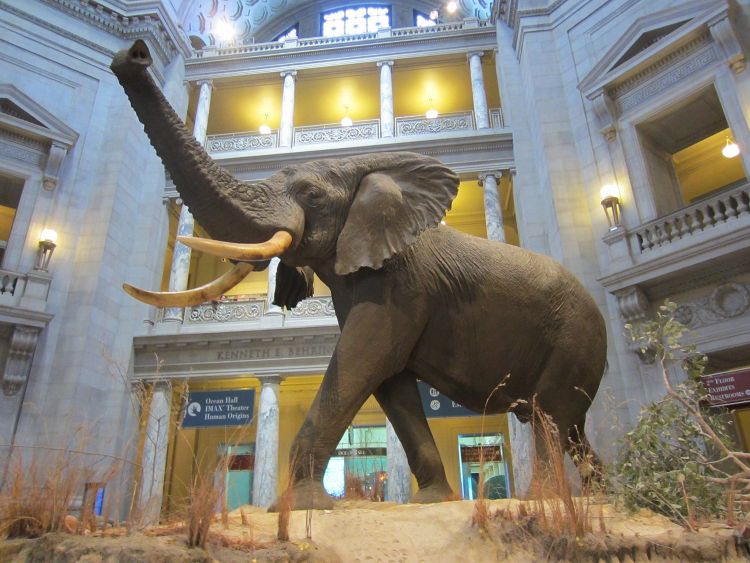
“Henry” the 11-ton African bush elephant has been on display in the Smithsonian National Museum of Natural History since 1956. This specimen stands more than 13-feet tall, which is taller than any known living elephant today. It was shot in Angola and donated to the museum by hunter Josef J. Fénykövi in 1955. (Image credit: Wikimedia Commons/Smithsonian National Museum of Natural History)
Biased, but still useful
What can we do with two flawed datasets of biodiversity? Quite a lot, Daru explained.
Go to the web site to view the video.
Understanding areas where specimen and observational datasets of biodiversity are deficient – and how they compare with one another – can help researchers and citizen scientists improve the biodiversity data collected in the future.
“Our maps of sampling biases and gaps can be incorporated into new biodiversity tools that are increasingly being developed, such as iNaturalist or eBird,” Daru said. “This can guide users so they don’t collect more records in areas that are oversampled and steer users to places – and even species – that are not well-sampled. So, I envision an app that you can use, kind of like Pokémon GO to search for rare species.”
To improve the quality of observational data, biodiversity apps can prompt collectors to have an expert verify the identification of their uploaded image, Daru explained.
Preserved specimens, on the other hand, are becoming scarce, and this study highlights their enduring value for biodiversity studies. To further emphasize the potential of this waning practice, the researchers also explained how such specimens are important for new lines of investigation that may arise, such as studying microbial symbionts and emerging diseases that require physical specimens from the past and present.
“It’s such a very useful resource that has been lying in the dark in cabinets across the globe,” Daru said. “It’s so exciting the possibility of things that can be done with these specimens.”
This research was supported by the U.S. National Science Foundation.
To read all stories about Stanford science, subscribe to the biweekly Stanford Science Digest.
Media Contacts
Holly Alyssa MacCormick, Stanford School of Humanities and Sciences: hollymac@stanford.edu
Author
Holly Alyssa MacCormick