
Study reveals significant discrepancies in common poverty measurement approaches
Researchers found almost no agreement among four widely used poverty measurement approaches. The findings suggest that the choice of a measurement approach can lead to very different conclusions about who qualifies for poverty alleviation programs and policies, and how much these efforts achieve.
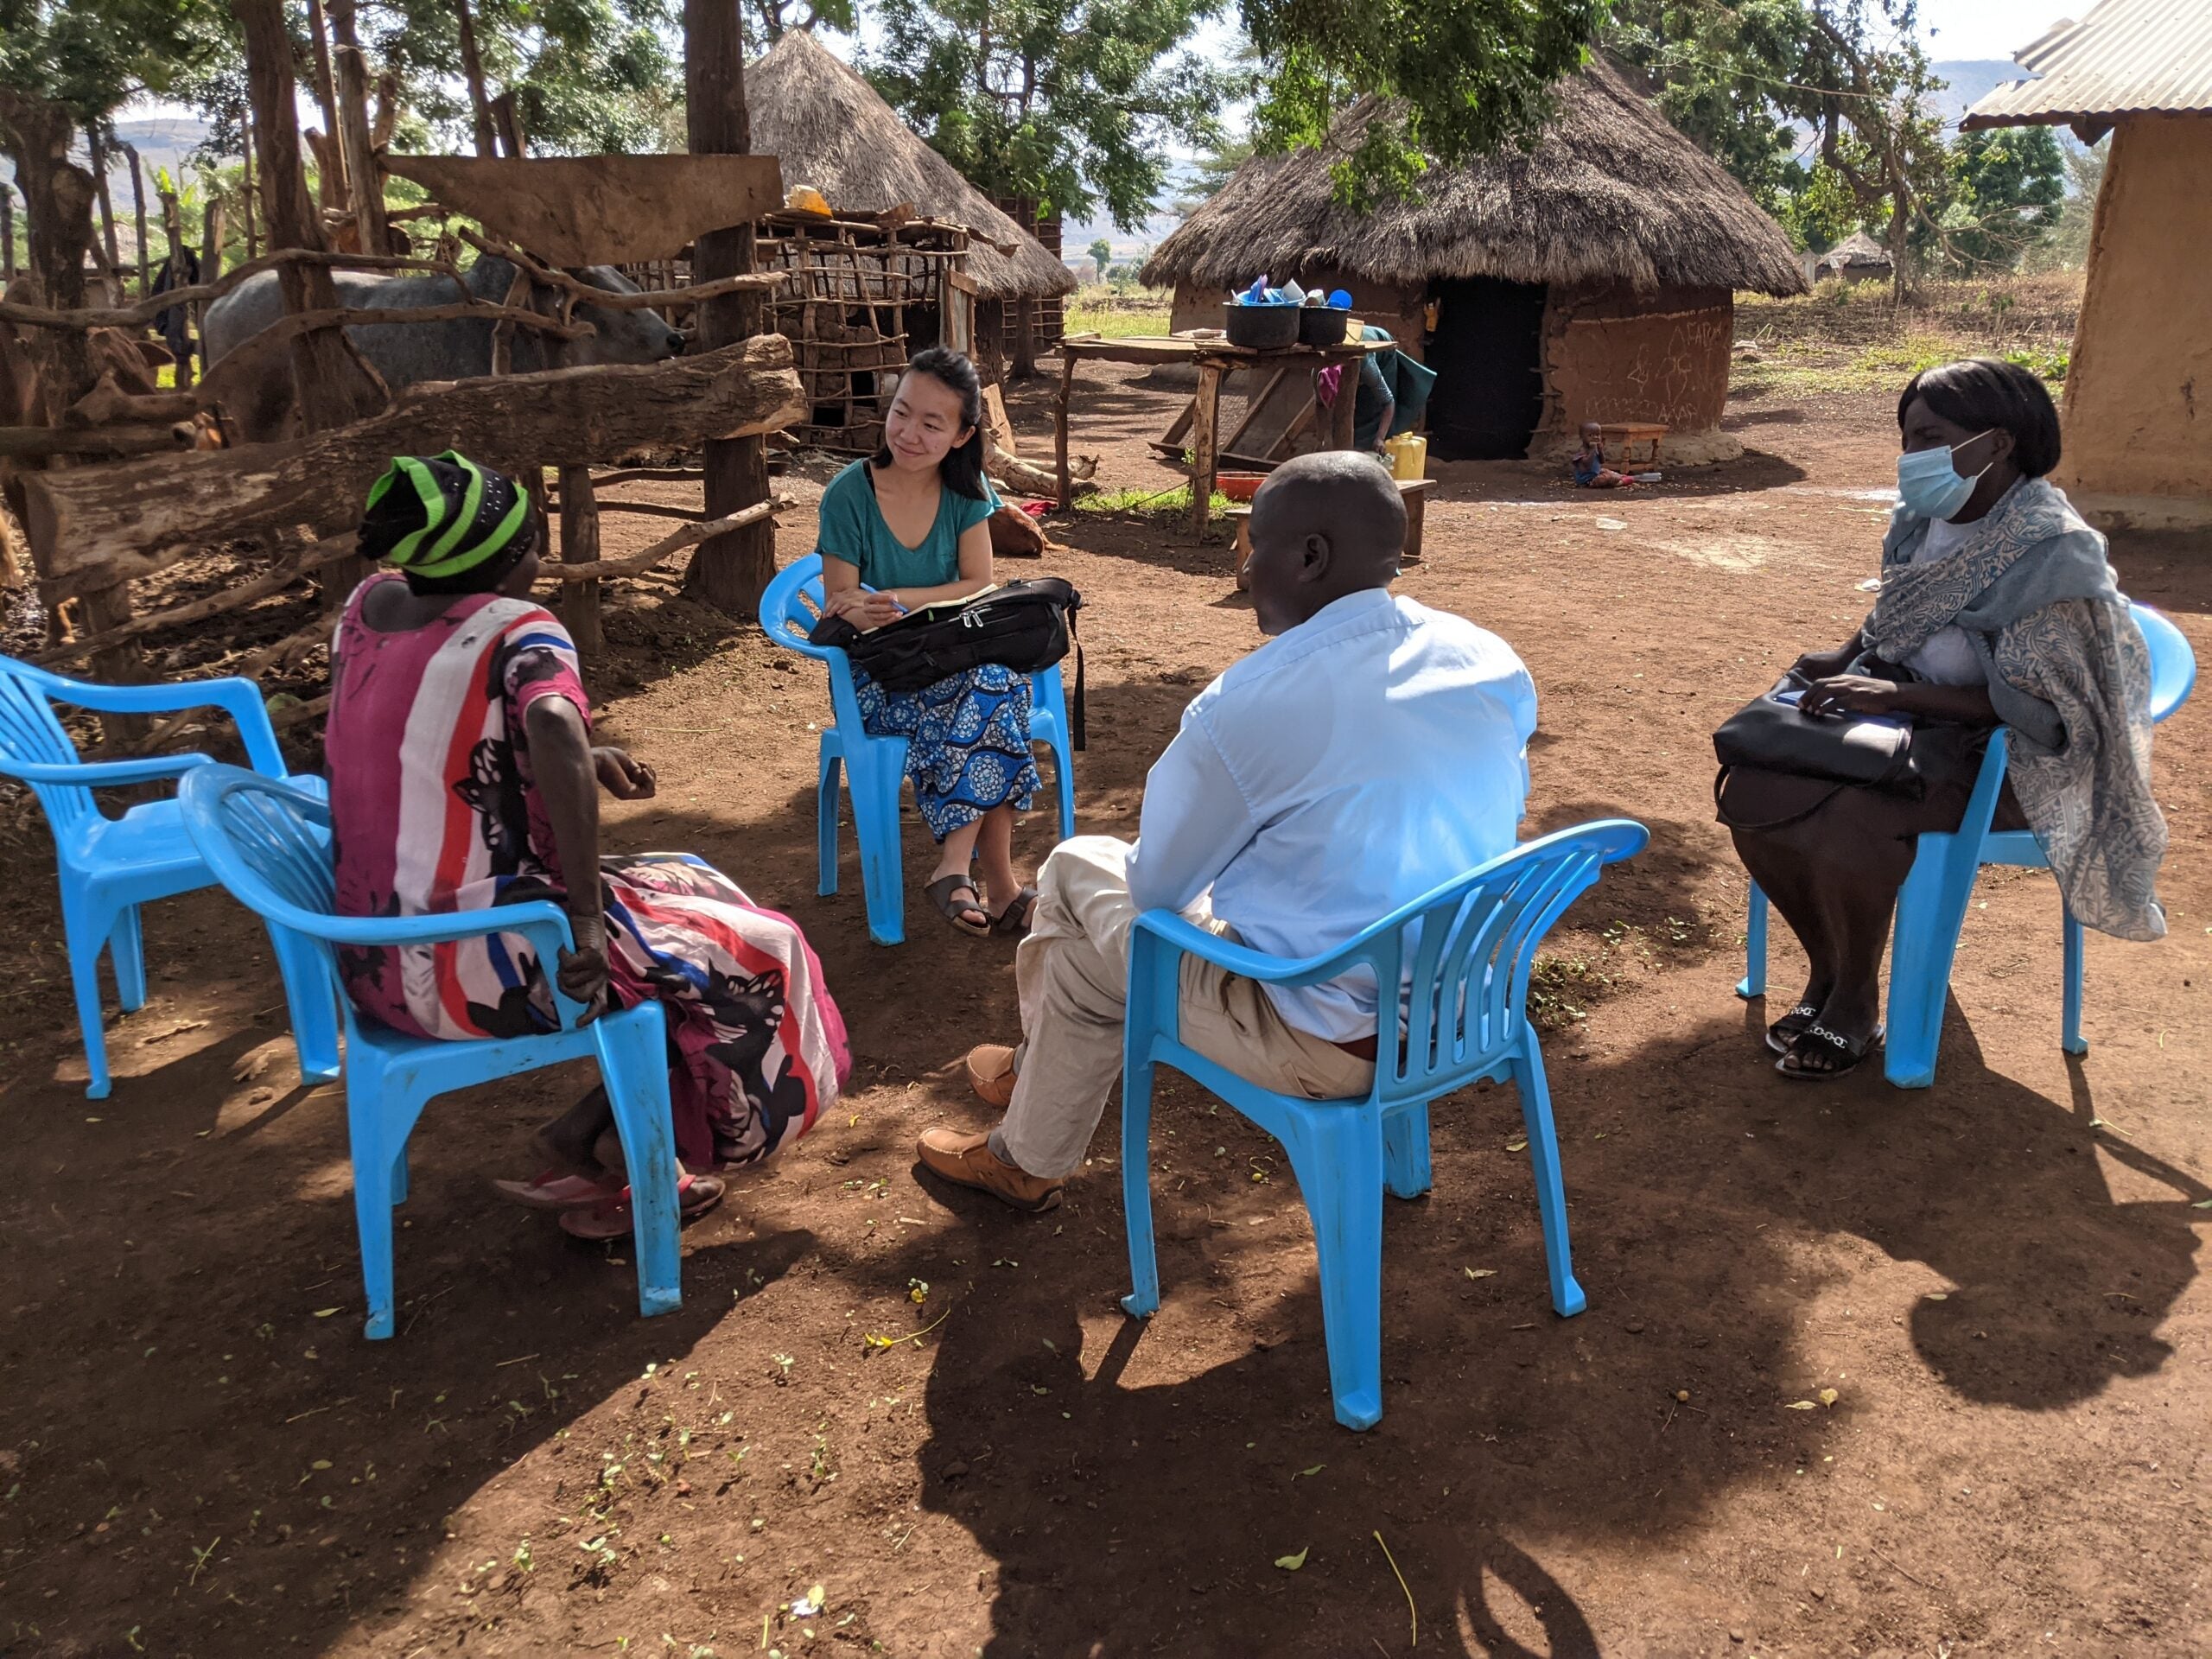
Stanford researcher Christine Pu interviews residents of rural Uganda to understand local perceptions and definitions of poverty. (Image credit: Courtesy of Christine Pu)
Methods commonly used to measure poverty can lead to vastly different conclusions about who actually lives in poverty, according to a new Stanford University-led study. Based on household surveys in sub-Saharan Africa, the first-of-its-kind analysis published Feb. 5 in Proceedings of the National Academy of Sciences underscores the importance of accurately defining and measuring poverty. Its findings could help inform how governments, nonprofit organizations, and international development agencies allocate resources and evaluate the effectiveness of poverty-alleviation policies around the world.
“They say you can’t manage what you don’t measure,” said study co-author Eric Lambin, the George and Setsuko Ishiyama Provostial Professor in the Stanford Doerr School of Sustainability and senior fellow at the Stanford Woods Institute for the Environment.
“In our study, we find how one chooses to measure poverty can completely change the extent to which programs and policies reach vulnerable populations,” said study lead author Christine Pu, a PhD student in environmental engineering at the Stanford Doerr School of Sustainability.
Comparing definitions
Governments around the world want to support households living in poverty, but it’s not always easy to determine which households need help. For example, two U.S. families of the same size could be classified as poor – and eligible for public support programs like food assistance and subsidized utility services – because their annual income is less than the federal $31,200 poverty guideline. In actuality, the families might have dramatically different overall costs or assets. For example, one might own their home and two cars, while the other might rent their home and depend on public transportation.
The study examined four widely used poverty measurement approaches. Each metric is based on different priorities ranging from reported assets, such as appliances, to self-defined well-being milestones, such as being able to send children to school. Working with colleagues in Ethiopia, Ghana, and Uganda, the Stanford researchers surveyed 16,150 households. Surprisingly, the research revealed almost no agreement in how these approaches ranked households by poverty status. The lack of agreement persisted even among households classified in the bottom 20% in terms of poverty.
Even after controlling for geographic variability, the study found weak correlations between the measurement approaches, indicating that the discrepancies were not simply due to regional differences. The differences in relative rankings were not small either. On average, households’ poverty rankings differed by 25 percentage points. In other words, a household ranked in the 25th percentile by one measurement might be ranked as the most impoverished household or as the median household by another measurement.
“Organizations that adopt a measurement approach without reflecting on how it fits their conception of poverty are, at best, rolling the dice about creating classifications of households that work in alignment with their mission and objectives,” the researchers write. “At worst, these organizations are adopting methodologies that may be wholly inappropriate for their poverty alleviation goals.”
Choosing wisely
One striking example of this conceptual misalignment is the U.S. government’s Demographic and Health Survey (DHS) Program wealth index. The index was designed to explain disparities in health outcomes. However, it is widely used to represent a household’s poverty status. This application can lead to counterintuitive rankings of households. For example, whereas most rural development specialists would consider livestock ownership to be a sign of family wealth, in Ghana and Ethiopia the value of a household’s DHS wealth index goes down for every additional livestock unit they own.
Given the widespread influence of the DHS wealth index, this measurement problem is being propagated and amplified through many applications and decision-making processes. The issue is not unique to the DHS wealth index, but emblematic of a larger problem embedded in many indices and measurement tools.
Overall, the findings suggest that the choice of a measurement approach can lead to very different conclusions about who qualifies for poverty alleviation programs and policies, and how much these efforts achieve. The authors argue that organizations should carefully consider their definition of poverty and select measurement approaches that align with their specific objectives.
Additional Stanford co-authors include Jenna Davis, associate dean for integrative initiatives in institutes and international partnerships, professor of civil and environmental engineering, Higgins-Magid Senior Fellow at the Stanford Woods Institute for the Environment, and director of the Stanford Program on Water, Health & Development. Additional co-authors are from the International Growth Research and Evaluation Center in Uganda, Addis Ababa University in Ethiopia, and Kwame Nkrumah University of Science and Technology in Ghana.
The study was funded by the Stanford King Center on Global Development, the Conrad N. Hilton Foundation, the Natural Science and Engineering Council of Canada, the Stanford Interdisciplinary Graduate Fellowship, and the Charles H. Leavell Fellowship.