|
November 26, 2013
U.S. methane emissions 50 percent higher than expected, Stanford researcher says
A new analysis of U.S. methane emissions indicates that previous studies underestimated emissions from human activity, particularly cattle farming and fossil fuel production. The work could provide a baseline for establishing new regulations of the powerful greenhouse gas. By Bjorn Carey

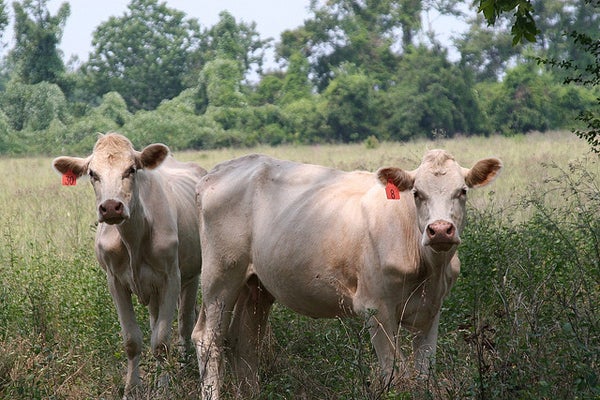
Cattle-raising operations are a significant source of methane in the atmosphere. (Creative Commons / Emmett Tullos)
The United States emits 1.5 times more of the greenhouse gas methane than leading estimates, according to a new study by a team of Earth and atmospheric scientists. The analysis points to undervalued emissions from human activity, particularly cattle farming and fossil fuel production, as the main drivers of the increase.
Like carbon dioxide, methane is a potent greenhouse gas that plays a significant role in trapping heat in the atmosphere and raising global temperatures. Methane also plays a key role in facilitating the formation of ozone in large cities.
Although there are several natural causes of methane emissions, roughly 60 percent of the global output can be traced back to human activities. Primary culprits include the extraction and refining of oil and natural gas, coal mining, landfills, cattle farming and manure management.
Two of the prevailing inventories of methane emissions, by the Environmental Protection Agency (EPA) and the international Emissions Database for Global Atmospheric Research (EDGAR), came to their conclusions by estimating the amounts of methane produced per cow or per unit of fossil fuel produced and extrapolated them to calculate total emissions.
"We call this a bottom-up approach," said co-author Anna Michalak, an Earth scientist in the Department of Global Ecology at the Carnegie Institution for Science and an associate professor by courtesy in Stanford's Department of Environmental Earth System Science. "It is essentially a book-keeping approach, and the uncertainties of the individual line items can compound when they are added up to estimate total emissions."
'Top-down' approach
The new analysis, which was led by Scot M. Miller, a graduate student at Harvard, is based on a "top-down" methodology developed by Michalak and her research group.
The researchers combined concentrations of atmospheric methane, as measured by the National Oceanic and Atmospheric Administration and the Department of Energy, with meteorological data of temperatures, wind and other factors that could influence the methane's atmospheric movements. They entered this combination in their computer model and, essentially, ran its statistical algorithms in reverse to trace the methane to its origins.
The results highlighted a huge discrepancy between the actual emissions seen in the atmosphere and those predicted by the inventories, Michalak said.
Looking at the country as a whole, the scientists found that actual methane emissions were 50 percent higher than the EPA and EDGAR inventories predicted.
The scientists paired regional methane emissions with activity plots – farming, fossil fuel production, etc. – to identify sources that were previously undervalued.
In the south central United States, for instance, total emissions are 2.7 times higher than the EDGAR inventory. Livestock, predominantly cattle, was a primary contributor, via animal flatulence and manure. Emission from oil and gas production and refining was 4.9 times higher than the inventory would suggest for this region.
Such significant increases could suggest areas and practices that could benefit from improved regulation.
Aiming for accuracy
This new data complements the inventories, Michalak said, and will clue scientists to which estimates in those inventories need improvement – or which factors are being completely overlooked – in order to create a more accurate analysis of the overall methane budget of the country.
In some cases, the spatial footprints of the observed emissions did not match those of any economic sectors as represented in the inventories, but the researchers were able to trace the origins using information about other atmospheric gases. Methane emissions are often coupled with other gases, and the mix of those gases differs depending on the source, creating a sort of fingerprint of the source.
For example, a particular large plot over the south central United States didn't map well on any known sources, but registered significant amounts of propane.
"We know that oil and gas production and refining, which is prevalent in this region, is coupled with large propane emissions," Michalak said. "This further supports our conclusion that this methane was coming from oil and gas production, and not cows or some other unidentified source."
Although the goal of the new study was not to influence or directly inform emissions regulations or climate policy, Michalak said that the robust estimates of current methane emissions provide a valuable baseline upon which to base future predictions and actions.
-30-
|